Which creative wins? Ask placement. Which placement wins? Ask creative.
Meta lets you run a different creative for every placement. The data says you should.
The assumption nobody checks
Most video ad campaigns on Meta start like this: you’ve got a few videos to try, you want them running across Instagram and Facebook, Reels and Feed, so you create a handful of ads, each carrying one video, leave placements on automatic, and let it go. Meta adjusts each video to fit the placement as needed, runs everything, watches, and shifts the budget toward whichever ad is pulling the best numbers. That’s the machine working.
But what it amplifies is shaped by what you gave it. Each ad carried a single video, meant to run across all placements at once — so the best it can find you is one video that does well on average, not the strongest video in each placement.
None of which would matter if a best-everywhere video existed. Truth be told, there is rarely such a thing — and it makes sense why, because the placements aren’t one audience. Feed is a slow scroll you default into; Reels is a lean-forward stream you swipe when something catches; Stories is a tap-tap-tap you can leave in a heartbeat. Different attention, different patience, different reason for being there. A video that owns one of those rooms has no obligation to work in the next, and often doesn’t.
The one-video-per-ad habit comes from a few places, part belief, part practical-seeming. Building a different cut for each placement is more work still, on top of the videos you’re already making. There’s a piece of old delivery lore that splitting creative across placements just starves each of budget. And the quiet one: even a team willing to build a different ad for Reels than for Feed wouldn’t know what to make different about it.
Underneath all three sits a single assumption, so taken-for-granted nobody checks it: a good ad is a good ad. Make one that works, and it works wherever it goes. Is that actually true? We checked.
A hundred videos in…
A hundred video ads. One account. Each ran across Facebook and Instagram, Feed and Reels — past a thousand impressions in every placement before it counted — 97 million impressions and ₹61 lakh in spend between them, none of it in the corners. Look at it the simplest way or the most sophisticated: it doesn’t matter. The data unequivocally returns the same verdict — which creative wins depends on the placement, and which placement wins depends on the creative. Here are the receipts.
Everything below is measured in one unit, so start there. A ThruPlay is a video watched to completion or for at least 15 seconds — Meta’s own standard for whether a video held its audience. Video ThruPlay Rate (VTR) is the rate of ThruPlays per impression, and it’s the yardstick for every receipt that follows.
Start with the simplest look. Meta scales the best-performing ad — and with one video per ad, that means the single video you uploaded. But performance isn’t one thing across placements. Rank the hundred videos by VTR inside each placement: each of the four placements crowns a different video. And the best video for Facebook Feed sits twenty-first on the blended, all-placements scoreboard: on that number, a Feed specialist reads as mid-pack — Feed gets whatever won overall, not the video that actually wins Feed.
And it isn’t the calendar: every video ran its four placements at once, and restricting the comparison to a single quarter reshuffles the rankings just as much.
It’s like hunting for one athlete to win the sprint, the swim, the cycling and the climb alike — different events, won by different people.
Next, someone will say “The difference in performance you see is because of the platform, not the creative — FB just runs hotter.” We tested that. We measured the platform effect first, comparing like with like: each ad’s Reels performance on FB against its Reels performance on IG. Across the hundred ads, FB averages about 1.2× IG — a 20% edge (1.19×, inverse-variance weighted; the simple median gives 1.22× — they agree). We made that the baseline expectation. Every ad is expected to run 20% higher on FB; matching that earns it no credit. Only then did we look at each ad individually: how far does its own FB-vs-IG gap sit from that baseline?
Here’s what we found: if the platform were the whole story, every ad would score about 20% higher on FB than on IG. Two in five ads — 39 of the 100 — don’t fit that story. 21 showed more than double the expected gap; 3 showed almost none of it; and 15 reversed it outright, scoring higher on IG. The platform explains the average gap. It cannot explain two in five ads standing this far from it, and in both directions.
Expected gap: FB ~20% higher than IG
| Count of Ads (out of 100) | |
|---|---|
| Showed roughly the expected gap (within ±20% from it) | 61 |
| Showed more than double the expected gap | 21 |
| Showed almost none of it | 3 |
| Outright reversed it (IG better than FB) | 15 |
Now you may be thinking: maybe it isn’t the platform but the format. Attention genuinely works differently across Feed and Reels, so perhaps “Feed just runs higher than Reels.” We tested that too.
We measured the format effect and made it the baseline expectation, the same way. On both platforms, Feed holds about 20% more viewers than Reels on average — 1.21× on Facebook, 1.19× on Instagram. Every ad is expected to show that gap; showing it earns nothing. Then we checked whether each ad’s performance actually held to it.
Here’s what we found: half the ads refuse this story too. If the format were the whole thing, every ad would hold about 20% more viewers on Feed than on Reels. On Facebook, 49 of the 100 don’t fit — 25 showed more than double the expected gap, and 24 showed none of it, every one reversing it outright. The format explains the average gap. It cannot explain every second ad defying it — in both directions. On Instagram, the findings are near identical: 48 of the 100 don’t fit — 28 leaning further into Feed, 20 toward Reels.
Expected gap: Feed ~20% higher than Reels — Facebook
| Count of Ads (out of 100) | |
|---|---|
| Showed roughly the expected gap (within ±20% from it) | 51 |
| Showed more than double the expected gap | 25 |
| Erased it — every one reversed outright (Reels higher) | 24 |
And the hardest test — is the performance difference just noise? Everything so far looked at ads one at a time. This one asks a single question of the entire dataset at once: could all of it be nothing but random wobble?
The instrument to check that is a well-established one — statisticians call it Cochran’s Q. It looks at the whole spread of gaps together and compares it against the spread that ordinary week-to-week wobble could produce on its own. Before using it, we calibrated it: we pointed it at a world where no true difference exists — each placement measured against itself, odd weeks versus even weeks. It read 1.1× on FB Reels and 1.3× on IG Reels, right around the 1× a no-difference world should show. The instrument reads true.
Then we pointed it at the real question — FB Reels versus IG Reels. It read 8.9×. Nine times what noise alone can produce. We pulled out the three biggest contributors: still above 4×. We gave it only half the data: 6.5×. The full data: 8.9× — while the calibration reading, what the instrument shows when the gaps are nothing but noise, sits around 1. Noise doesn’t compound. Signal does.
Meta’s tell: placement asset customisation
The evidence is settled: performance depends on the placement. Which raises the next question — does Meta let you act on it, and run a different creative for each placement within a single ad? Meta’s answer is an emphatic yes.
The feature is called placement asset customisation. Inside a single ad, you supply several distinct assets — different images or videos — and decide which one shows in which placement, rather than stretching a single creative across all of them. And Meta has documented it for a long time: as far back as 2019, the first thing its help page listed under what you can do was “use different assets” — its example, a product image or video on Facebook and a brand image or video on Instagram — with “use different crops” lower down. Running genuinely different creative wasn’t a workaround; it was the headline use, named first. And it’s still how the product works: Meta’s current developer documentation, as of June 2026, says you “can specify multiple creative assets for each asset type, including images, videos, carousels, headlines, and body text.”
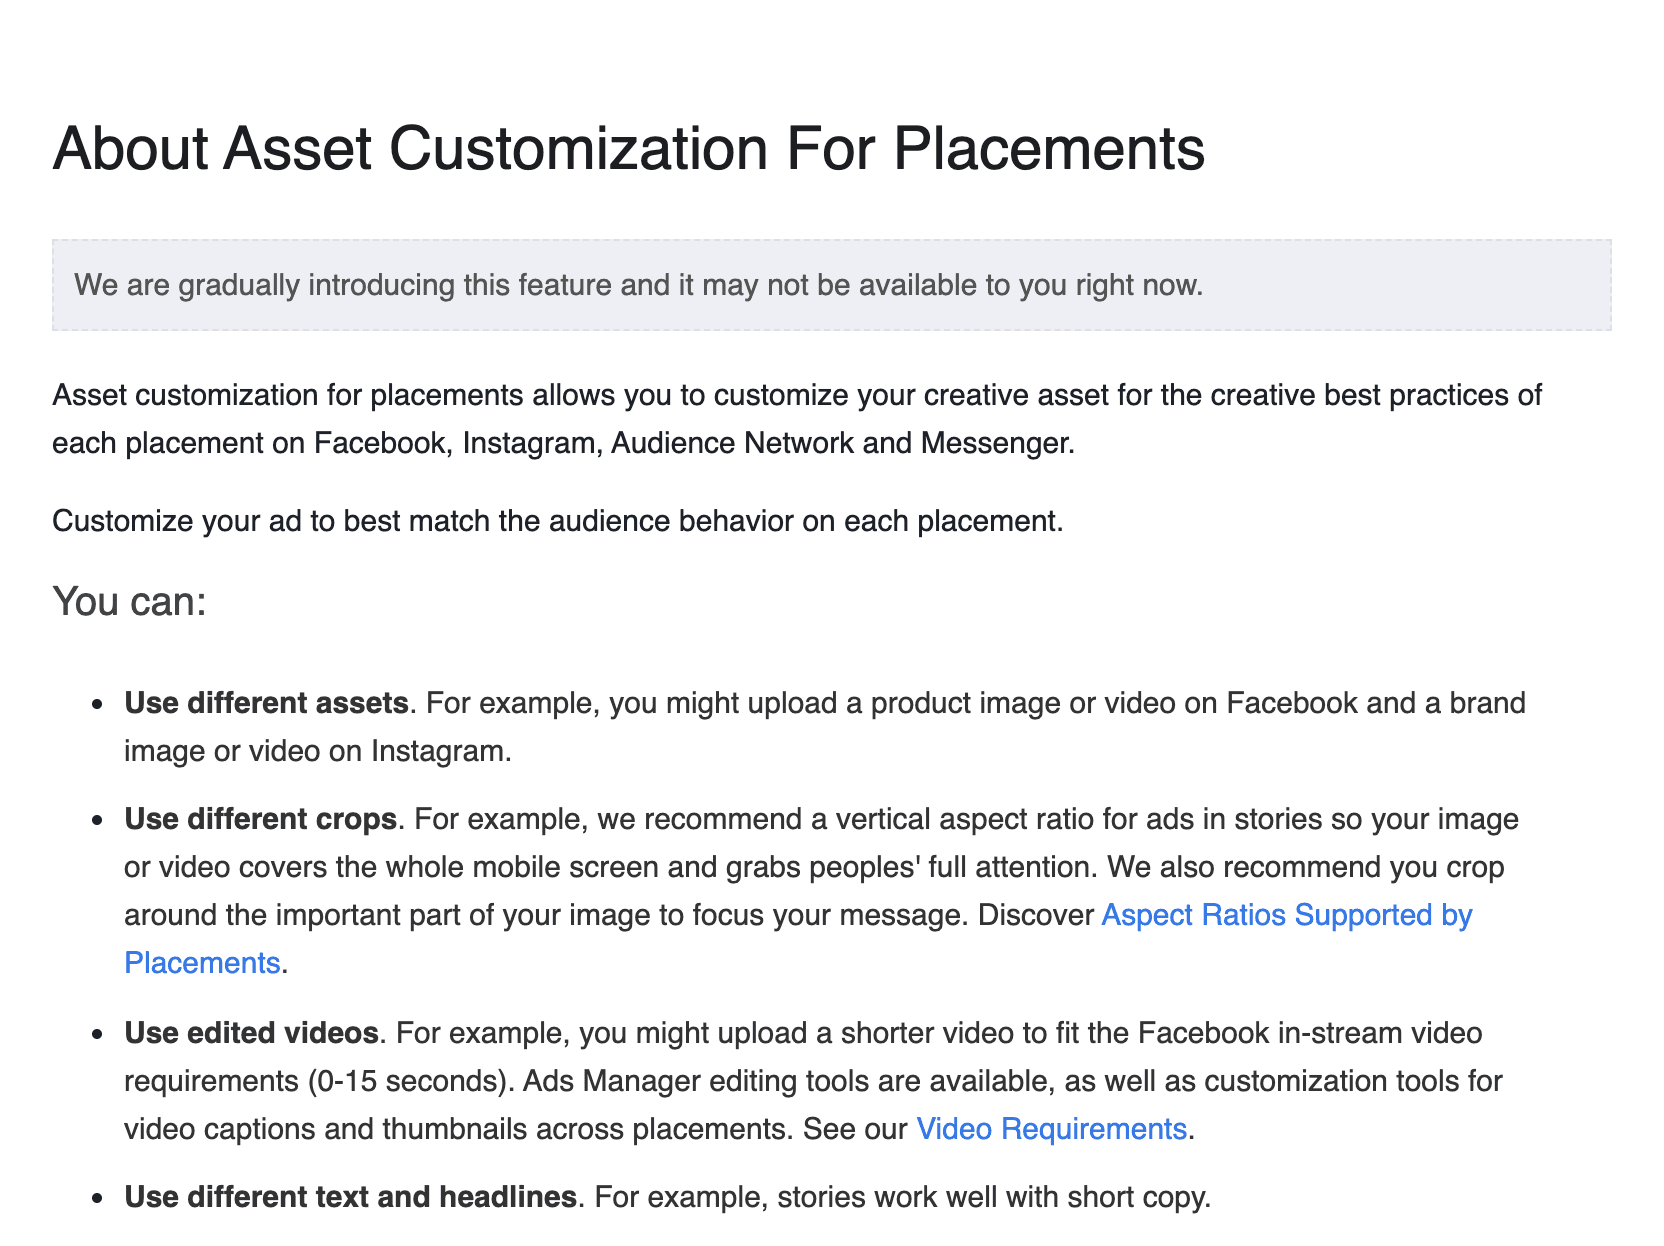
That is a tell. No one knows what performs on Meta better than Meta, and no one has more riding on the answer — their revenue is advertisers performing well enough to keep spending. A platform with that much at stake doesn’t build the machinery for an effect it considers imaginary. The platform’s own tooling points where the receipts already did: what works depends on where it runs.
The old worry — that splitting creative across placements starves each of budget — isn’t true either; it belonged to a world of separate ads fighting over the same spend. Placement asset customisation runs inside one ad, alongside Meta’s automated placement: one system decides where the ad shows, the other decides what shows there. You customise for performance and you keep the reach.
And the confirmation that this pays comes straight from Meta. Meta doesn’t award an impression to the highest bid; it awards it to the highest total value. The widely cited formula:
Total value = Bid × Estimated action rate + Ad quality
Bid — what you’re willing to pay to get the outcome you’re optimising for.
Estimated action rate — Meta’s estimate of how likely this person is to take that action; for a video view, that’s your projected VTR.
Ad quality — a measure of the ad’s quality, from feedback (like people hiding the ad) and low-quality tells: withheld information, sensationalised language, engagement bait.
The multiplication is the point: the estimated action rate doesn’t nudge your bid, it scales it. And Meta’s own page states the consequence: “an ad that’s more relevant to a person could win an auction against ads with higher bids.”
Raise your projected VTR and you win the same impression at a lower bid — the cheapest lever you have on cost.
So what do you do about it
The tool exists. It gives you the same reach. It offers better performance.
But almost nobody uses it — for reasons that don’t hold. Some don’t know the feature exists; more know it but file it under cropping, never as a place to run a different idea. Some won’t take on the added production — more creatives to script, shoot and edit per concept — but that cost only balloons if you keep guessing: know what a placement rewards and you make a few deliberate cuts, not a heap of hopeful ones. The subtlest reason is the belief that you don’t need to choose at all — that you can hand Meta a stack of creatives and let it match them to placements for you, sparing you the deliberate work. But that only moves the guessing; it doesn’t remove it. Meta picks the best of what you give it; it can’t build the set or lift a weak one. Feed it four poor creatives and it finds you the best poor creative. The choosing is Meta’s. The making is yours.
Everything points the same way: you can lift performance by customising the creative to the placement. But what really separates using that well from not is knowing what to change — and that’s the hard part. You can now see that a video wins in one placement and loses in another. What you can’t see is why: which of its choices earned the win, and what to change for the placement where it died. The scoreboard shows the result, never the cause. So you’re left sure you should build differently for each placement — with no way to know what “differently” means.
The money question, then: how do you learn which creative works in which placement? There’s method to it — and there’s madness. We’ll write about both.
For the statistically curious
Disclosure: one advertiser’s account, as delivered by Meta, across fifteen months from March 2025 to May 2026. A video and its placement crops count as one ad. A video entered the analysis only after crossing a thousand impressions in every placement. Rankings compare ads within one placement, against the same field of a hundred; across placements, an ad is only ever compared with itself.
Data. One advertiser’s Meta account, Mar 2025–May 2026. Unit = creative concept: placement renders (crops, re-uploads) pooled, membership visually verified. n = 100 videos, qualifying rule ≥1,000 impressions in each of FB Reels, IG Reels, FB Feed, IG Feed (min cell 1,075; median ≈30,000). Delivery across the four placements is simultaneous (median start-date spread: 0 days). The four placements carry 93% of account impressions. Metric: VTR = ThruPlays ÷ impressions; video durations cluster at 38–49s, so the 15-second threshold is comparable across placements. All figures are as-delivered; observed reversals are a lower bound.
Rankings. All rankings are within-placement. Split-half reliability (alternating days): Spearman 0.80–0.96; re-measurement moves the median video 4–5 ranks (p90 10–17), with zero top-third↔bottom-third crossings. Cross-placement at matched volume: median ≈9 ranks, p90 35–38, 5–6 third-crossings; disattenuated cross-placement agreement ≤0.79. Champions and the #21 result are full-period standings. Temporal checks: single-quarter restriction shifts agreement by <0.02; among 560 concurrent pairs (≥7 shared days, ≥500 impressions per video per placement on those days), 18% are discordant across placements on identical days (8% at ≥10% margins both sides); 21% and 19% on the Feed and cross-format axes.
Baselines and buckets. Gap = within-creative VTR ratio. Baselines are medians: platform 1.22× (inverse-variance-weighted mean 1.19×; conclusions invariant), format 1.21× (FB), 1.19× (IG). Under IVW the IG format baseline falls to 1.10× — volume-weighting dilutes the Feed edge — bucket classification uses the median throughout. Buckets: full-period ratio within ±0.20 (absolute) of the baseline ratio — platform par 1.22× → band 1.02×–1.42×, so “roughly the expected gap” spans from almost none of it to double it — exhaustive and disjoint (platform: 61/21/3/15; FB format: 51/25/24, the 24 all raw reversals; IG format: 48 beyond margin, 28/20). Repeatability variant: same side, ≥20% beyond baseline, in both alternating-day halves independently → 26/100 (14 FB, 12 IG); permutation control on mismatched halves → ≈7.
Heterogeneity. Cochran’s Q on log-ratios; variances by week-block bootstrap (B = 1,000; eligibility: two week-halves per side, ≥300 impressions each → n = 82); reported as Q/df. Self-vs-self controls (odd/even weeks): 1.1× (FB Reels), 1.3× (IG Reels). FB Reels × IG Reels: 8.9×; excluding the three largest contributors: 4.3×; half-data: 6.5×. Day-level resampling inflates the FB Reels control to 4× via within-week autocorrelation — hence week blocks throughout.
Robustness. Median/MAD standardisation orders identically to the rankings used (ρ = 1.0000, all placements). Stories placements fall below the impression floor (29 videos reach 1,000 in IG Stories) and are excluded by rule.
Common questions
Which Meta placement performs best?
There isn’t one. If placement alone drove performance, every ad would carry the same placement gap — the stronger placement stronger for all of them. It doesn’t. Across our hundred ads, Facebook averaged about 20% higher than Instagram, yet 39 broke that gap and 15 reversed it, running higher on Instagram. The Feed-versus-Reels gap broke the same way for half of them. Placement sets an average; the creative decides where each ad lands. There’s no best placement — only the best creative for each one.
Should I run the same video across every placement, or a different one for each?
A different one. In our hundred, not one video was best everywhere: each of the four placements crowned a different winner, and the video that won Facebook Feed ranked only twenty-first once all placements were scored together. The placements aren’t one audience — Feed is a slow scroll, Reels a lean-forward stream — so a video that owns one has no claim on the next. Meta’s own placement asset customisation lets you run a different creative per placement inside a single ad.
If I use Advantage+ (automatic) placements, doesn’t Meta already handle this?
No. Advantage+ decides which placements show your ad — not what that ad is. That’s on you: give it one video and the same video runs in every placement. And our data shows a video that wins one placement can lose the next. So matching the creative to the placement is still your job — Advantage+ never took it off your hands. Meta just hands you the tool for it: placement asset customisation, a different creative per placement inside one ad.
Isn’t placement customization just re-cropping the video to fit each format?
No. Re-cropping fits one video to four shapes; the opportunity is running four different videos. Our evidence shows a genuinely different video wins in each placement — not the same one re-framed. Meta’s own placement asset customisation names “use different assets” as its first use, ahead of “use different crops”: different images or videos per placement. Reformatting is table stakes. Choosing a different creative per placement is the lever.
Could these placement differences just be random noise?
No. We ran the standard test for exactly this — is the spread of differences bigger than random week-to-week wobble? Calibrated first against a world with no real difference — each placement against itself, odd weeks versus even — it read about one, as it should. Against the real comparison, Facebook Reels versus Instagram Reels, it read about nine times what chance produces. Drop the three biggest contributors: still above four. Halve the data: six and a half. Noise doesn’t compound. Signal does.
Does customizing creative per placement cost me reach or budget — or does it pay?
It costs nothing in reach, and it pays. The old worry that splitting creative starves each placement of budget belonged to a world of separate ads fighting over one budget — placement asset customisation runs inside a single ad, alongside automatic placement, so the reach is untouched. And Meta’s published auction rewards it: Meta awards each impression to the highest total value — your bid times its estimated action rate, plus ad quality — not the highest bid. A creative that fits the placement lifts the projected view rate in that estimate, so it wins the same impression for a lower bid.